How a 600-Person Austrian Grid Operator Broke SCADA Data Silos in 8 Weeks
SCADA readings trapped in PI System, outages reported via phone. One grid operator unified 4 data sources in 8 weeks.
Ovidiu Pica
Author
31 Mar 2026
Published
6
Views
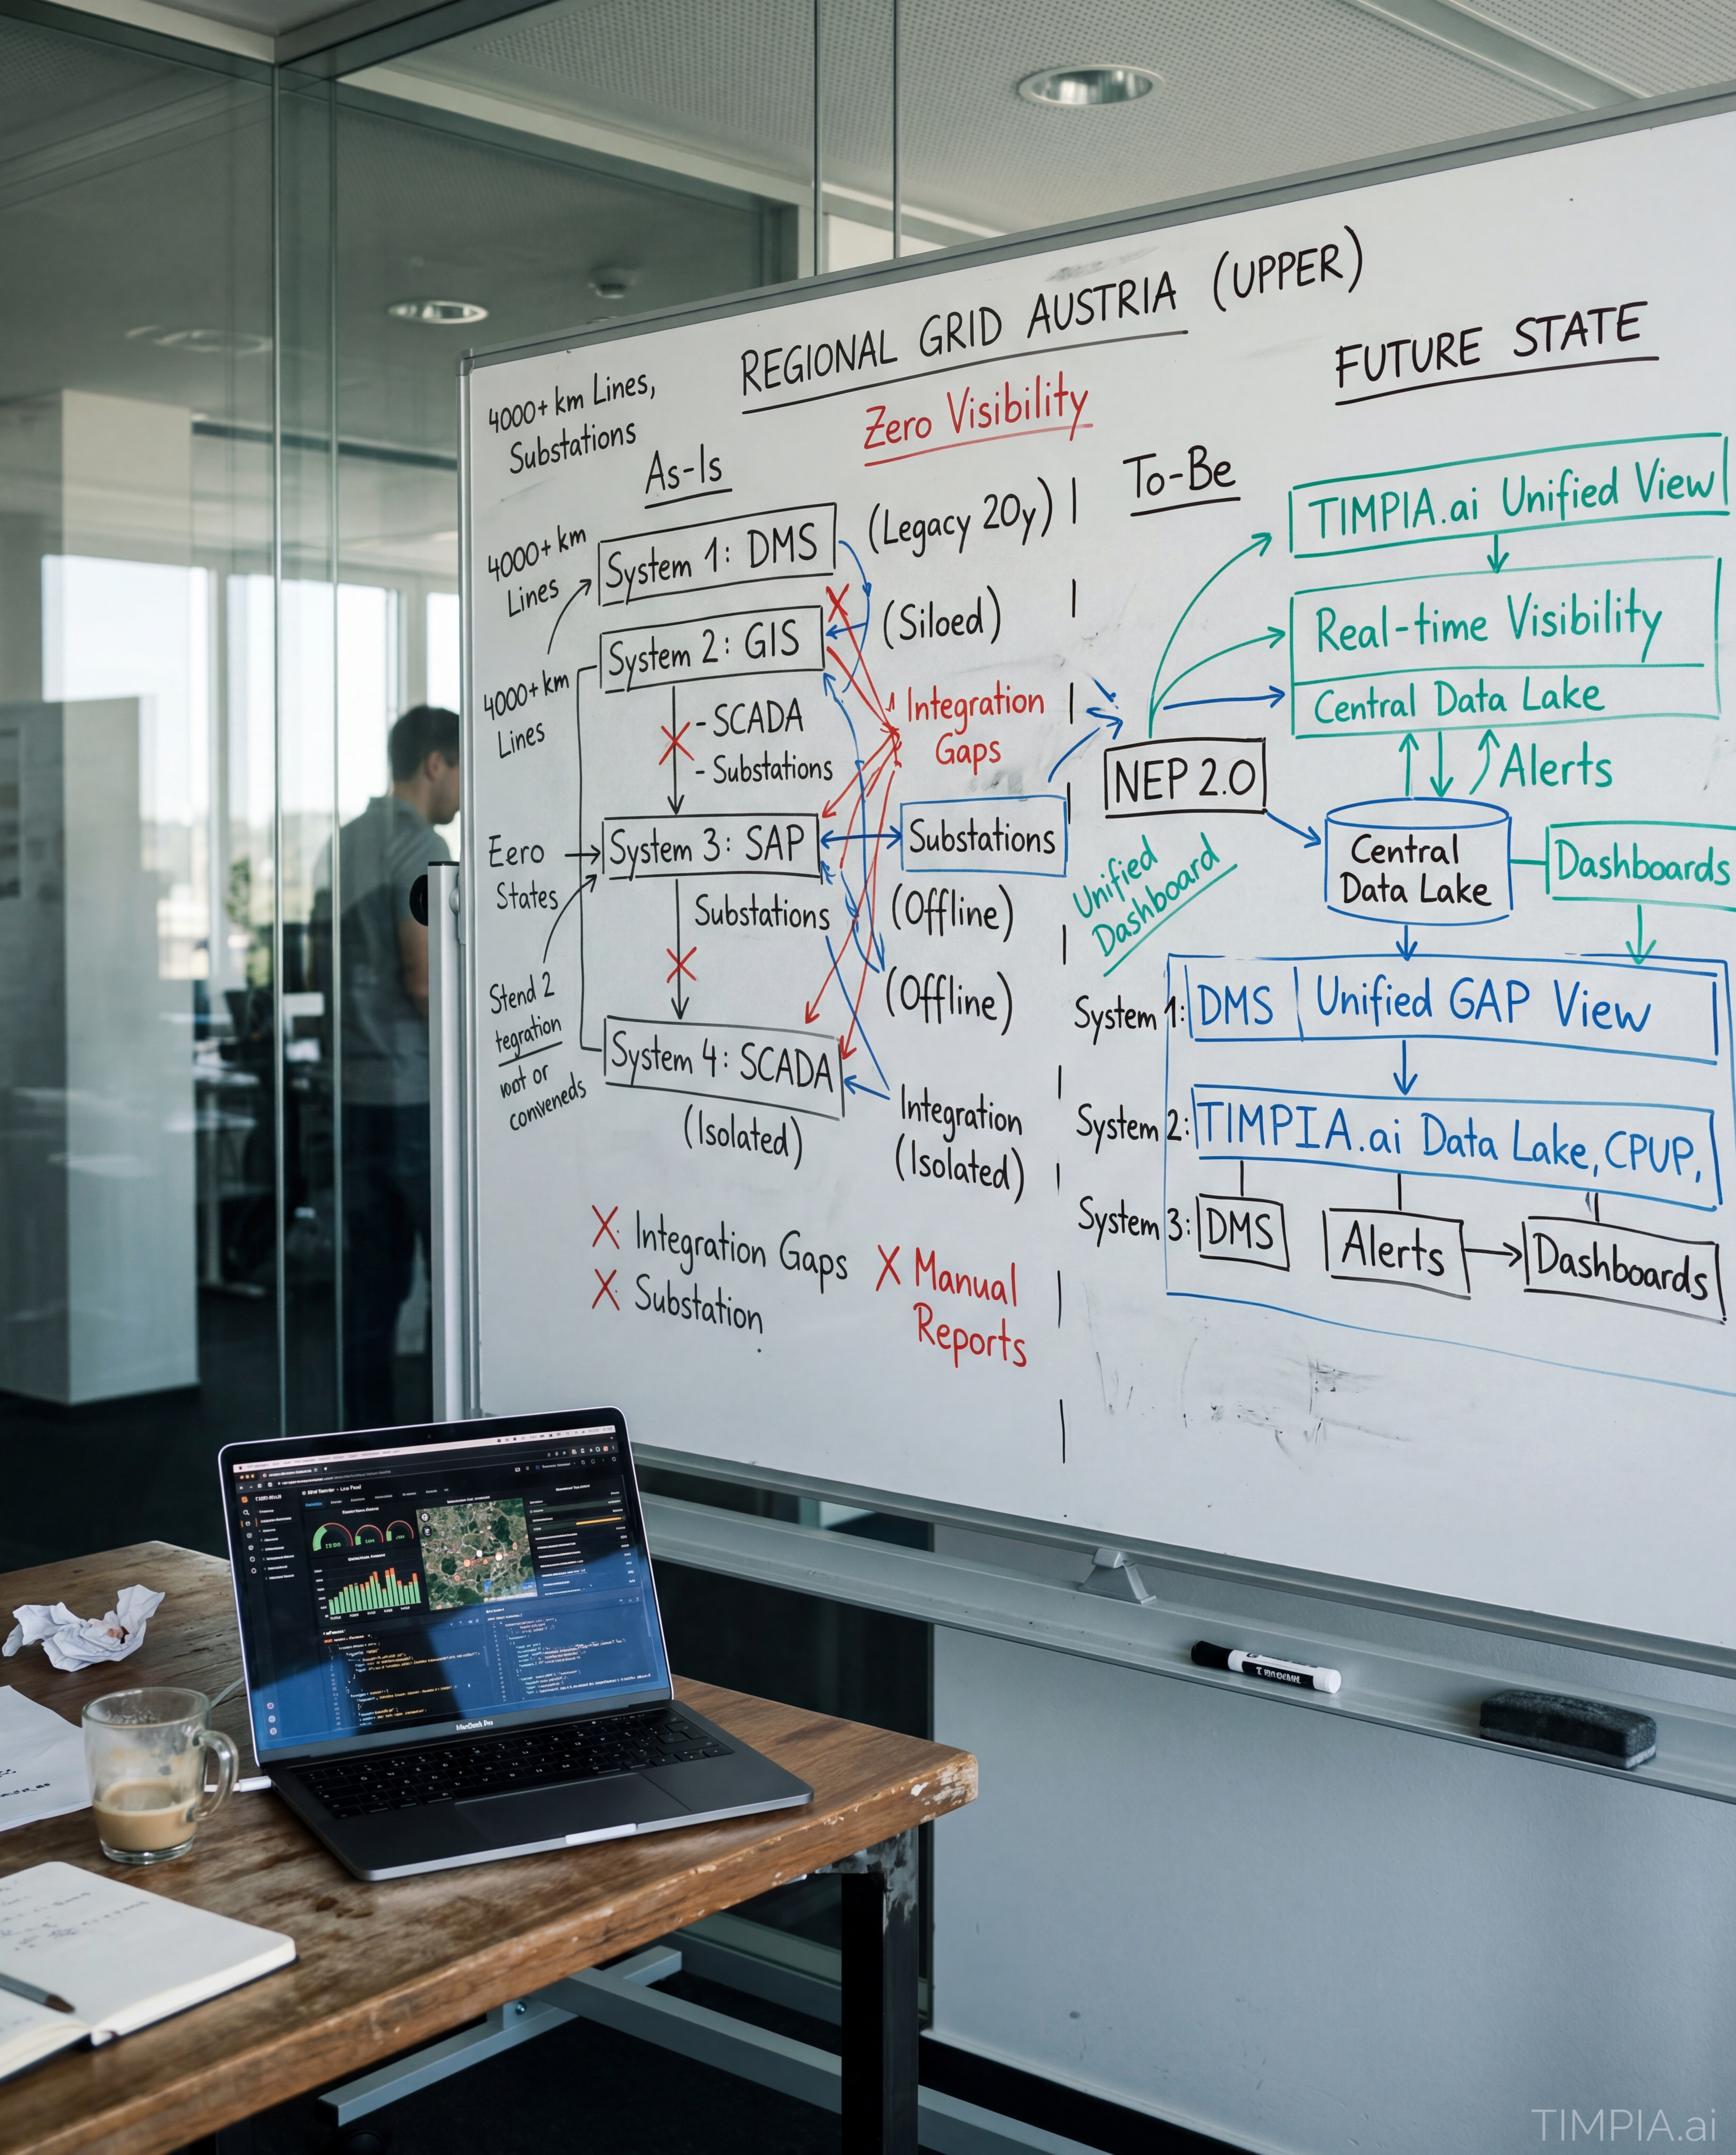
The Situation: Four Systems, Zero Visibility
A regional grid operator in Upper Austria, 600 employees, managing 4,200 km of medium and high-voltage lines. Their Head of Grid Operations had been in the role for twelve years. He knew every substation by name. What he didn't have was a single screen showing him real-time status across all of them.
Their tech stack had grown organically over two decades:
- SCADA system (Siemens) for real-time grid monitoring
- PI System (OSIsoft) for historical data archiving
- SAP PM for maintenance work orders
- Excel trackers (fourteen of them) for everything SAP couldn't handle
Field technicians at substations would call the control room for readings that existed in PI System but weren't accessible on their tablets. Control room operators would manually transcribe SCADA alarms into SAP PM to create work orders. Asset performance data lived in PI System; maintenance history lived in SAP PM. Nobody could see both together.
The company passed ISO 55000 audits, but just barely. Compliance documentation required pulling data from all four systems manually.
The Problem: 52 Hours Per Week of Data Wrangling
When I first spoke with their Director of Asset Management, she put it bluntly: "We have all the data. We just can't use it."
Here's what that looked like in practice:
Control room to field: When a field technician needed historical load data for a transformer inspection, they called the control room. A control room operator would pull up PI System, read the values over the phone, and the technician would write them on paper. Average time: 8 minutes per request. Frequency: 40+ requests per day.
SCADA to SAP PM: Every alarm that required maintenance triggered a manual process. Control room operator copies alarm details from SCADA, opens SAP PM, creates work order, attaches alarm screenshot. Average time: 12 minutes. Error rate on equipment IDs: 11%.
Monthly asset reports: The Asset Management team needed performance trends (load patterns, temperature anomalies, trip frequency) alongside maintenance history. One analyst spent three days each month exporting PI System data, cleaning it in Excel, matching it to SAP PM work orders by equipment ID, and building the report.
Audit preparation: Before each ISO 55000 audit cycle, two engineers spent two weeks assembling compliance documentation. This meant the same 3-person, 2-week audit preparation cycle we see across the industry.
The SCADA data silos in this energy company weren't a technology problem. They were an integration problem. Each system worked fine. They just couldn't talk to each other.
flowchart TB
    subgraph "Before: Fragmented Data Flow"
        SCADA[SCADA System<br/>Real-time alarms] -->|"manual copy, ~12min"| ControlRoom[Control Room Operator]
        ControlRoom -->|"phone call, ~8min"| FieldTech[Field Technician]
        ControlRoom -->|"manual entry"| SAPPM[SAP PM<br/>Work Orders]

        PI[PI System<br/>Historical Data] -->|"export CSV"| Analyst[Asset Analyst]
        SAPPM -->|"export report"| Analyst
        Analyst -->|"3 days/month"| Excel[Excel Consolidation]
        Excel -->|"manual matching"| Report[Monthly Asset Report]

        SCADA -.->|"no connection"| PI
        PI -.->|"no connection"| SAPPM
    end

    style SCADA fill:#ffcccc
    style PI fill:#ffcccc
    style SAPPM fill:#ffcccc
    style Excel fill:#ffffcc
What We Built: One Integration Layer, Not a Replacement
The Head of Grid Operations was clear about constraints: "We're not replacing SCADA. We're not replacing SAP. We're not migrating off PI System. Whatever you build has to work with what we have."
That ruled out most enterprise solutions, which want to become the new system of record. Instead, we built an integration layer that sits between their existing systems.
Week 1-2: Data mapping and API connections
We mapped every data source:
- SCADA: OPC-UA connection for real-time alarms and readings
- PI System: PI Web API for historical data queries
- SAP PM: RFC connection for work order creation and equipment master data
The critical discovery: equipment IDs weren't consistent. SCADA used a 6-digit code. PI System used the same code with a prefix. SAP PM used a completely different numbering scheme inherited from an acquisition in 2009. We built a translation table covering 2,847 pieces of equipment.
Week 3-4: Field technician interface
We built a tablet application for field technicians. When they scan a QR code on a transformer (labels we helped them deploy), they see:
- Current load and temperature (from SCADA, real-time)
- 90-day load trend (from PI System)
- Last 5 maintenance events (from SAP PM)
- Open work orders for this equipment
No phone calls. No waiting. The data they used to call the control room for is now in their hands.
Week 5-6: Automated work order creation
SCADA alarms meeting specific criteria now generate SAP PM work orders automatically. An AI agent parses the alarm, identifies the equipment (using our translation table), checks for existing open work orders on that equipment, and either creates a new work order or appends to an existing one.
The parser handles 23 different alarm types, each with different required fields in SAP PM. We built rules with their maintenance planning team to set priority levels based on alarm severity and equipment criticality.
Week 7-8: Unified dashboard and reporting
The control room now has a single screen showing:
- Real-time grid status (SCADA data)
- Predictive alerts based on historical patterns (PI System data)
- Maintenance status overlay (SAP PM data)
The monthly asset report that took 3 days now generates automatically. Data flows from PI System and SAP PM into a unified data model. The analyst reviews and annotates rather than assembles.
sequenceDiagram
    participant SCADA
    participant Integration as Integration Layer
    participant PI as PI System
    participant SAP as SAP PM
    participant Tablet as Field Tablet
    participant Dashboard

    Note over Integration: Equipment ID Translation Table (2,847 assets)

    SCADA->>Integration: Real-time alarm (OPC-UA)
    Integration->>Integration: Parse alarm, translate equipment ID
    Integration->>SAP: Check existing work orders (RFC)
    SAP-->>Integration: No open WO for this asset
    Integration->>SAP: Create work order (auto)

    Tablet->>Integration: QR scan (asset lookup)
    Integration->>SCADA: Current readings
    Integration->>PI: 90-day history (PI Web API)
    Integration->>SAP: Maintenance history
    Integration-->>Tablet: Unified asset view (<2 sec)

    PI->>Integration: Historical data (scheduled)
    SAP->>Integration: WO status updates
    Integration->>Dashboard: Unified grid view
The Results: Before and After
We measured outcomes over the first 90 days of operation.
Field technician data requests:
- Before: 40+ phone calls per day, average 8 minutes each
- After: 4-6 calls per day (edge cases only)
- Time saved: 280 minutes/day = 4.7 hours/day
- Monthly savings: ~94 hours
Work order creation:
- Before: 12 minutes per alarm, 11% equipment ID error rate
- After: Automated, <30 seconds, 0.3% error rate (edge cases requiring manual review)
- Time saved per work order: 11.5 minutes
- Average work orders created monthly: 180
- Monthly savings: 34.5 hours
- Error reduction: Quality issues from wrong equipment assignments dropped by 97%
Monthly asset reporting:
- Before: 3 analyst-days per month
- After: 4 hours review and annotation
- Monthly savings: 20 hours
Audit preparation:
- Before: 2 engineers, 2 weeks (160 person-hours)
- After: 2 engineers, 3 days (48 person-hours)
- Per audit cycle savings: 112 hours
- With 2 audit cycles per year: 224 hours annually
Total time savings calculation:
| Process | Monthly Hours Saved | Annual Hours |
|---|---|---|
| Field data requests | 94 | 1,128 |
| Work order creation | 34.5 | 414 |
| Asset reporting | 20 | 240 |
| Audit prep | 18.7 (annualized) | 224 |
| Total | 167.2 | 2,006 |
At a blended rate of EUR 65/hour for technical staff in Austria, that's EUR 130,390 in annual labor savings.
But the Head of Grid Operations pointed to a different number: response time. Before, an alarm required 12 minutes of administrative work before a technician could be dispatched. Now it's under 2 minutes. For critical equipment, that 10-minute difference matters.
flowchart LR
    subgraph "After: Unified Data Flow"
        SCADA2[SCADA System] -->|"OPC-UA, real-time"| Integration[Integration Layer<br/>Equipment ID Translation]
        PI2[PI System] -->|"PI Web API"| Integration
        SAPPM2[SAP PM] <-->|"RFC"| Integration

        Integration -->|"< 2 sec"| Tablet2[Field Tablets<br/>Unified Asset View]
        Integration -->|"auto-generate"| SAPPM2
        Integration -->|"real-time"| Dashboard2[Control Room Dashboard]
        Integration -->|"scheduled"| Report2[Auto-Generated Reports]
    end

    style Integration fill:#ccffcc
    style Tablet2 fill:#ccffcc
    style Dashboard2 fill:#ccffcc
What Made This Work (and What Almost Didn't)
Three factors made this project succeed where previous integration attempts had failed.
1. Equipment ID translation was non-negotiable.
Their previous attempt at integration (2019, with a different vendor) failed because it assumed equipment IDs would be consistent. When they weren't, the project stalled in a six-month "data cleansing" phase that never completed. We built the translation table in week one and treated it as a living document. Ninety days in, they've added 43 corrections and 12 new equipment records.
2. We didn't try to replace their no-code tools.
They had automations in Power Automate and some early Zapier workflows that were showing strain. Rather than rip those out, we built our integration layer to work alongside them. The Power Automate flows that still worked kept running. The ones that didn't got replaced gradually.
3. Field technicians were involved from week three.
The tablet interface went through four iterations based on technician feedback. The first version showed too much data. The final version shows exactly what they need: current state, recent history, open work orders. Nothing else.
What's Next for Them
Phase two starts next month: predictive maintenance alerts. The PI System historical data, combined with SCADA real-time readings, can identify transformers showing early signs of thermal stress. Instead of waiting for an alarm, the system flags equipment for inspection before failure.
They're also extending the integration to their district heating subsidiary (280 employees, separate SCADA system, same SAP PM instance). That's a 6-week project using the architecture we've already built.
If This Looks Familiar
SCADA data silos in energy companies aren't unusual. What's unusual is fixing them without a multi-year, multi-million-euro platform replacement project.
If your grid operations team is still calling the control room for readings, or your asset managers spend days each month assembling reports from multiple systems, or your compliance documentation takes weeks instead of days, we've done this before.
The proof-of-concept costs EUR 3,500. In the first 7 days, we connect to your existing systems and show you what unified data looks like. You keep the working prototype whether or not you continue.
Tags
Thanks for reading!
Be the first to react